This page is a generated report for a
Web Polygraph
experiment labeled ``PET_DIGEST_TEST''.
1. Executive summary
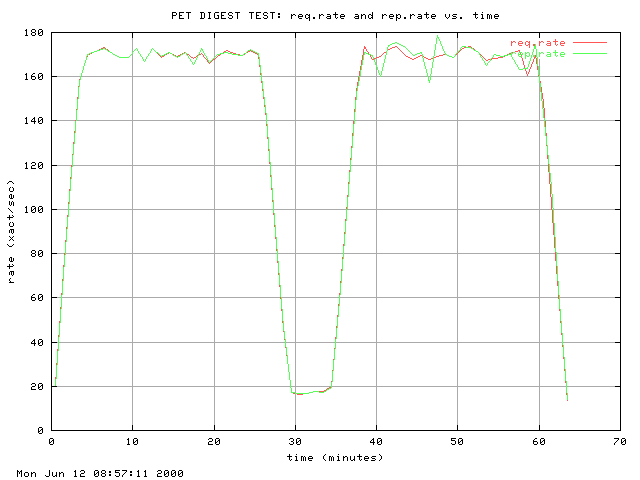
| Throughput: | 259.45 | rep/sec |
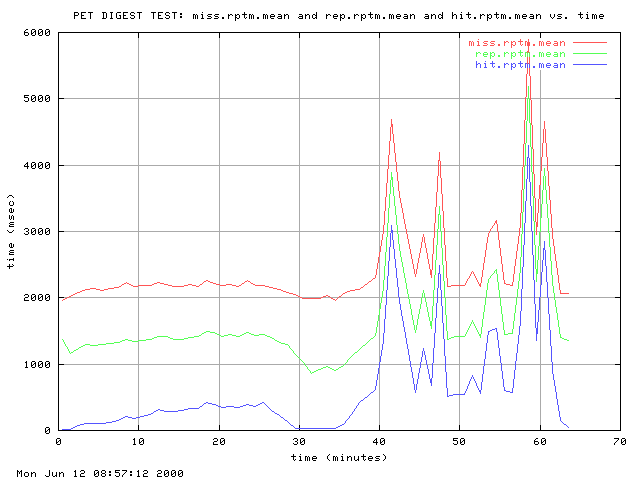
| Response time: | 1735.31 | msec |
| - misses: | 2519.92 | msec |
| - hits: | 765.12 | msec |
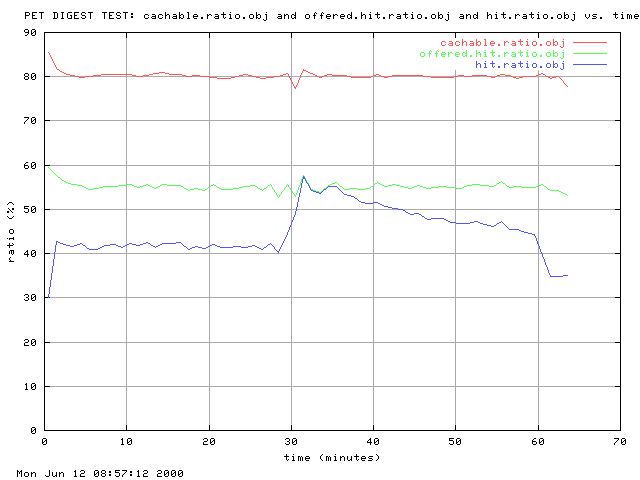
| Hit Ratio: | 44.71 | % |
| Errors: | 0.09 | % |
| Duration: | 0.57 | hour |
Phases: Morning&Morning|Day&Day|Evening&Evening|Night
2. Engineer summary
1.00 logs
were used to generate this report.
| Load |
Count
(xact/sec) |
Volume
(MBits/sec) |
| Offered: |
259.33 |
1.57 |
| Measured: |
259.45 |
1.57 |
| Hit Ratios |
DHR
(%) |
BHR
(%) |
| Offered: |
55.13 |
62.59 |
| Measured: |
44.71 |
50.78 |
| Cachability Ratios |
Count
(%) |
Volume
(%) |
| Measured: |
80.19 |
91.02 |
| Response Times |
Response Time (msec) |
| Min |
Median |
Mean |
Max |
| hit |
3.00 |
31.00 |
765.12 |
93782.00 |
| miss |
5.00 |
2155.50 |
2519.92 |
96683.00 |
| cachable |
|
|
|
|
| uncachable |
|
|
|
|
| fill |
|
|
|
|
| rep |
3.00 |
1213.50 |
1735.31 |
96683.00 |
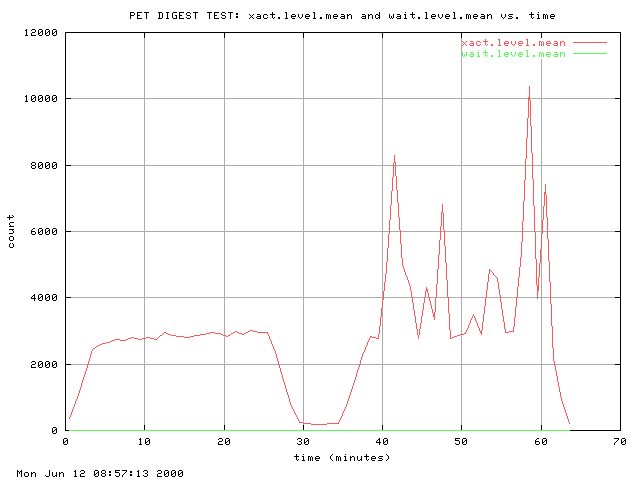
| Wait Queue |
requests |
| Enqueued: | 0.00 |
| Dequeued: | 0.00 |
| Average length: | |
| Stream Rates |
Count
(rep/sec) |
Volume
(MB/sec) |
| hit |
116.00 |
0.80 |
| miss |
143.45 |
0.78 |
| cachable |
208.05 |
1.43 |
| uncachable |
51.40 |
0.14 |
| fill |
92.06 |
0.63 |
| rep |
259.45 |
1.57 |
| Stream Totals |
Count
(rep*106) |
Volume
(GByte) |
| hit |
0.24 |
0.20 |
| miss |
0.29 |
0.19 |
| cachable |
0.43 |
0.36 |
| uncachable |
0.11 |
0.04 |
| fill |
0.19 |
0.16 |
| rep |
0.53 |
0.39 |
| Connection Length |
Min |
Mean |
Max |
| Use (xact/conn) |
1.00 |
1.00 |
1.00 |
| Life time (msec) |
3.00 |
1735.31 |
96683.00 |
| Object Sizes |
Size (KB) |
| Min |
Median |
Mean |
Max |
| hit |
|
|
0.88 |
|
| miss |
|
|
0.69 |
|
| cachable |
|
|
0.88 |
|
| uncachable |
|
|
0.35 |
|
| fill |
|
|
0.88 |
|
| rep |
0.30 |
0.61 |
0.78 |
6.50 |
| Object Class |
Contribution (%) |
| Count |
Volume |
| hit |
44.71 |
50.78 |
| miss |
55.29 |
49.22 |
| cachable |
80.19 |
91.02 |
| uncachable |
19.81 |
8.98 |
| fill |
35.48 |
40.25 |
| rep |
100.00 |
100.00 |
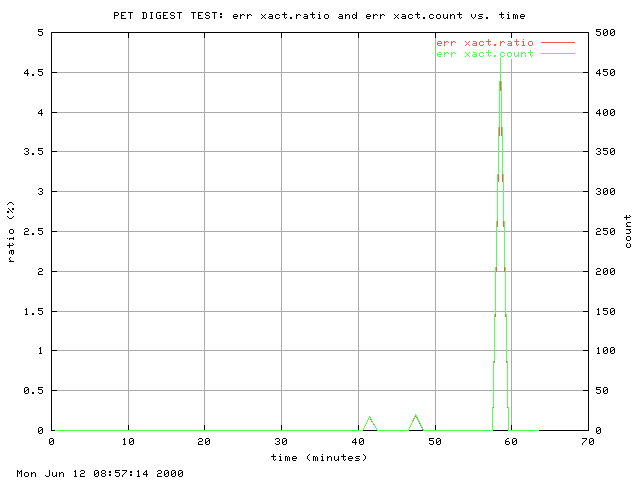
Errors (0.09% of all transactions):
#errno  count count% explanation
    24   1012 100.00 "Too many open files"
Potential problems:
- Measured document hit ratio (44.71%) differs
from the offered DHR (55.13%)
by -18.90%.
- Measured byte hit ratio (50.78%) differs
from the offered BHR (62.59%)
by -18.87%.
- ... where A differs from B by X% means X = 100*(A-B)/B.
3. Traces

Generated on Mon Jun 12 08:57:14 2000 by ./make_report PET_DIGEST_TEST