This page is a generated report for a
Web Polygraph
experiment labeled ``PET-130''.
1. Executive summary
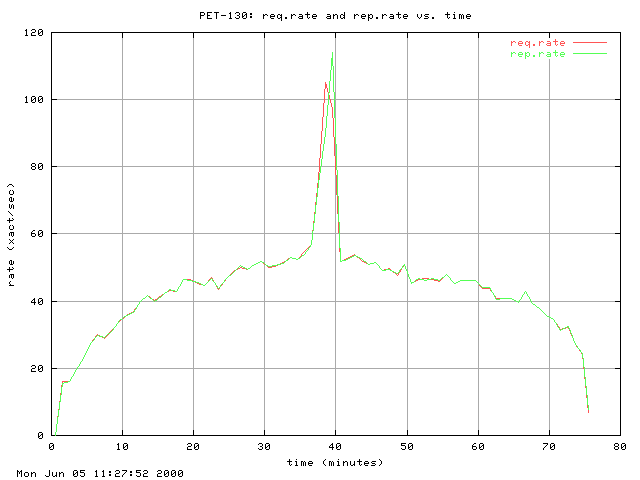
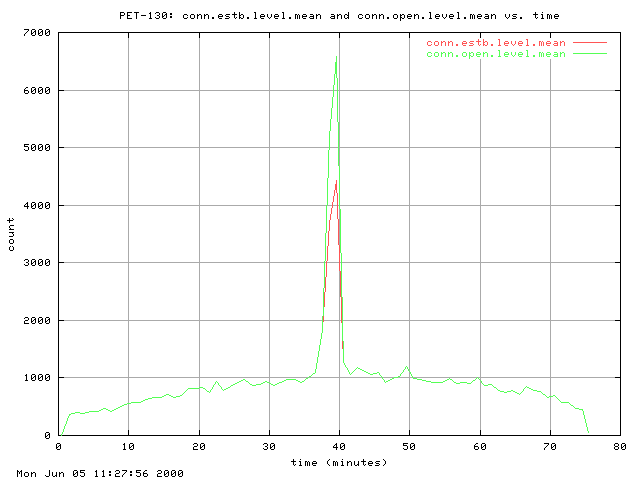
| Throughput: | 44.88 | rep/sec |
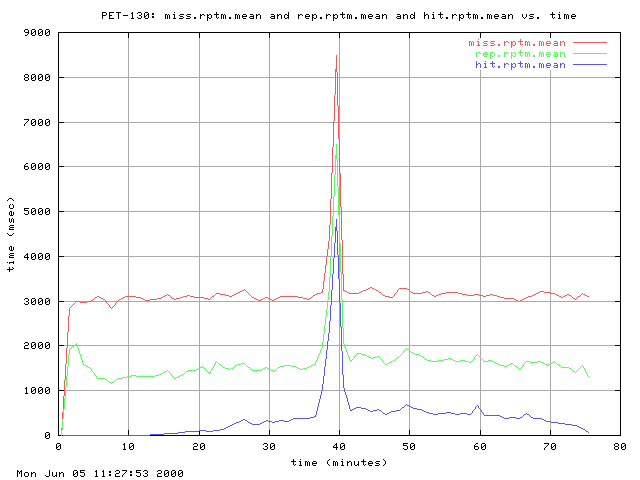
| Response time: | 1753.93 | msec |
| - misses: | 3293.15 | msec |
| - hits: | 518.09 | msec |
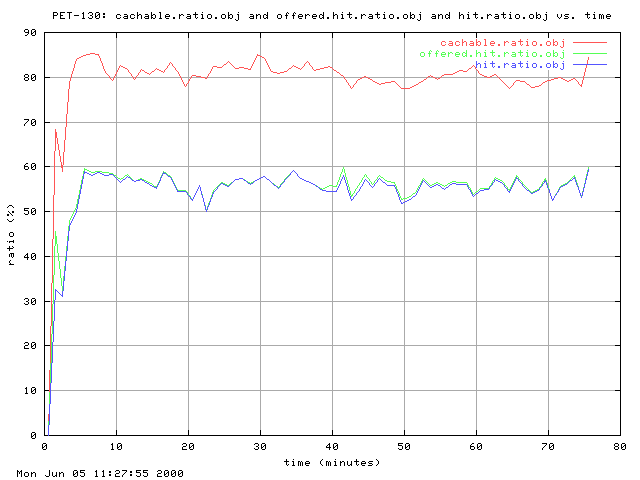
| Hit Ratio: | 55.47 | % |
| Errors: | 1.08 | % |
| Duration: | 1.22 | hour |
Phases: warm&warm&warm&warm&warm&warm&warm|meas&meas&meas&meas&meas&meas&meas|work&work&work&work&work&work&work|top&top&top&top&top&top&top|work2&work2&work2&work2&work2&work2&work2|meas2&meas2&meas2&meas2&meas2&meas2&meas2
2. Engineer summary
7.00 logs
were used to generate this report.
| Load |
Count
(xact/sec) |
Volume
(MBits/sec) |
| Offered: |
44.83 |
3.67 |
| Measured: |
44.88 |
3.68 |
| Hit Ratios |
DHR
(%) |
BHR
(%) |
| Offered: |
55.95 |
54.89 |
| Measured: |
55.47 |
54.38 |
| Cachability Ratios |
Count
(%) |
Volume
(%) |
| Measured: |
80.58 |
79.43 |
| Response Times |
Response Time (msec) |
| Min |
Median |
Mean |
Max |
| hit |
2.00 |
28.00 |
518.09 |
87512.00 |
| miss |
4.00 |
3139.50 |
3293.15 |
58461.00 |
| cachable |
|
|
|
|
| uncachable |
|
|
|
|
| fill |
|
|
|
|
| rep |
2.00 |
1039.50 |
1753.93 |
87512.00 |
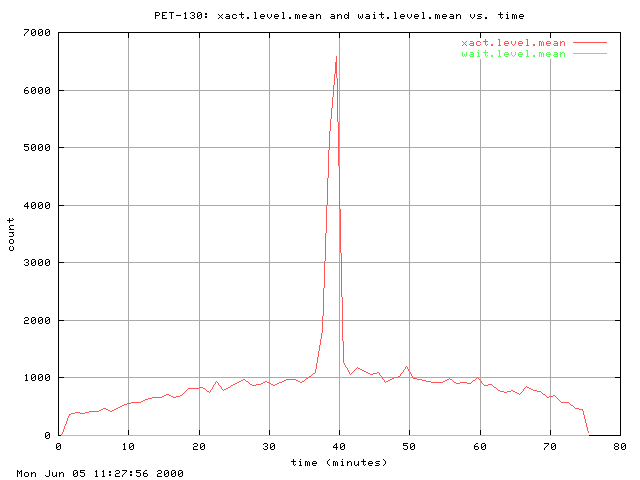
| Wait Queue |
requests |
| Enqueued: | 0.00 |
| Dequeued: | 0.00 |
| Average length: | 0.00 |
| Stream Rates |
Count
(rep/sec) |
Volume
(MB/sec) |
| hit |
24.89 |
2.00 |
| miss |
19.99 |
1.68 |
| cachable |
36.16 |
2.92 |
| uncachable |
8.72 |
0.76 |
| fill |
11.27 |
0.92 |
| rep |
44.88 |
3.68 |
| Stream Totals |
Count
(rep*106) |
Volume
(GByte) |
| hit |
0.11 |
1.06 |
| miss |
0.09 |
0.89 |
| cachable |
0.16 |
1.55 |
| uncachable |
0.04 |
0.40 |
| fill |
0.05 |
0.49 |
| rep |
0.20 |
1.95 |
| Connection Length |
Min |
Mean |
Max |
| Use (xact/conn) |
1.00 |
1.00 |
1.00 |
| Life time (msec) |
2.00 |
1753.93 |
87512.00 |
| Object Sizes |
Size (KB) |
| Min |
Median |
Mean |
Max |
| hit |
|
|
10.28 |
|
| miss |
|
|
10.74 |
|
| cachable |
|
|
10.34 |
|
| uncachable |
|
|
11.11 |
|
| fill |
|
|
10.46 |
|
| rep |
0.30 |
5.52 |
10.49 |
416.93 |
| Object Class |
Contribution (%) |
| Count |
Volume |
| hit |
55.47 |
54.38 |
| miss |
44.53 |
45.62 |
| cachable |
80.58 |
79.43 |
| uncachable |
19.42 |
20.57 |
| fill |
25.11 |
25.05 |
| rep |
100.00 |
100.00 |
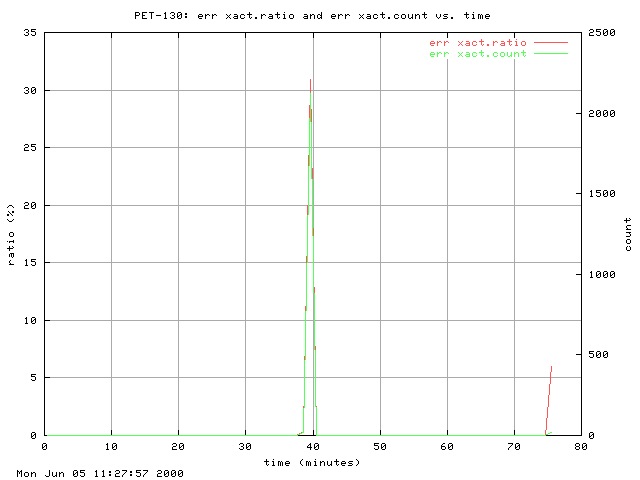
Errors (1.08% of all transactions):
#errno  count count% explanation
    32    536  25.06 "Broken pipe"
   104    502  23.47 "Connection reset by peer"
   261    205   9.58 "connection closed before sending headers"
   262    896  41.89 "no Content-Length header"
Potential problems:
- Error ratio (1.08%) exceeds 0.10%.
- ... where A differs from B by X% means X = 100*(A-B)/B.
3. Traces
Generated on Mon Jun 5 11:27:57 2000 by ./make_report PET-130