This page is a generated report for a
Web Polygraph
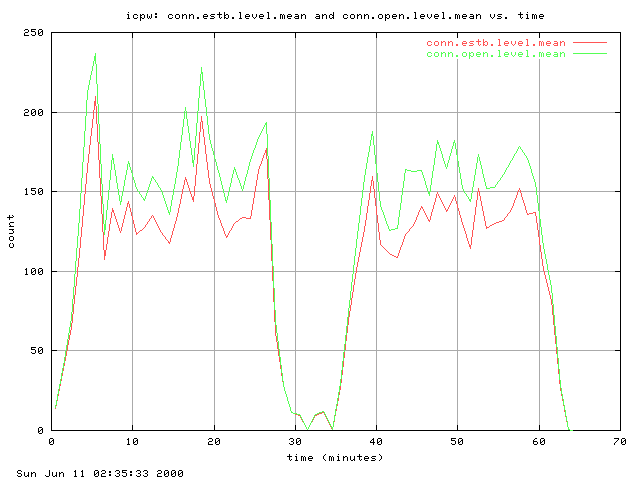
experiment labeled ``icpw''.
1. Executive summary
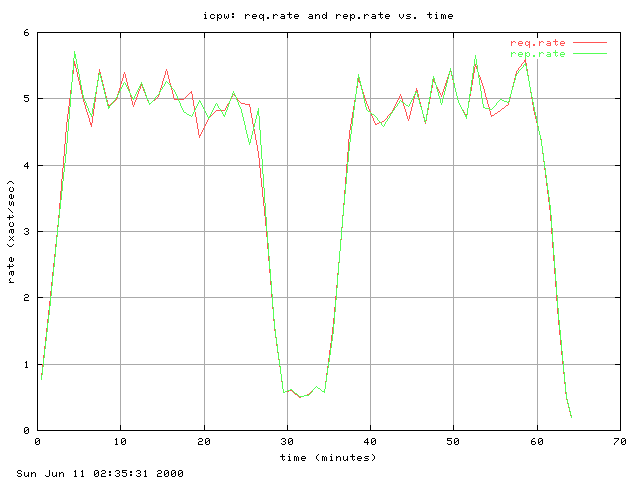
| Throughput: | 7.64 | rep/sec |
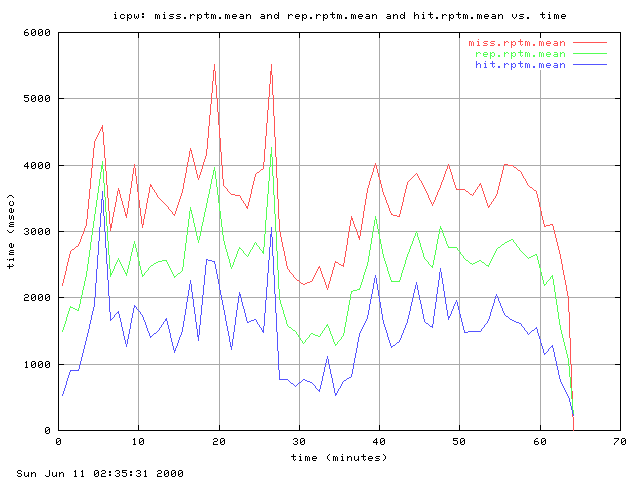
| Response time: | 2659.42 | msec |
| - misses: | 3634.74 | msec |
| - hits: | 1691.78 | msec |
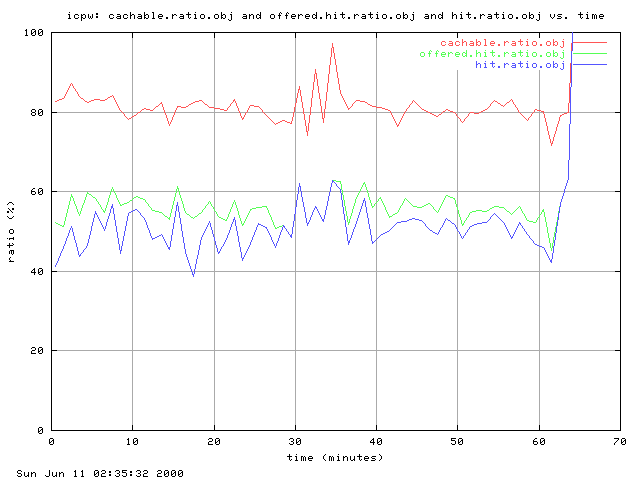
| Hit Ratio: | 50.20 | % |
| Errors: | 0.00 | % |
| Duration: | 0.57 | hour |
Phases: Morning&Morning|Day&Day|Evening&Evening|Night
2. Engineer summary
1.00 logs
were used to generate this report.
| Load |
Count
(xact/sec) |
Volume
(MBits/sec) |
| Offered: |
7.64 |
0.78 |
| Measured: |
7.64 |
0.78 |
| Hit Ratios |
DHR
(%) |
BHR
(%) |
| Offered: |
55.81 |
66.75 |
| Measured: |
50.20 |
59.94 |
| Cachability Ratios |
Count
(%) |
Volume
(%) |
| Measured: |
80.76 |
97.45 |
| Response Times |
Response Time (msec) |
| Min |
Median |
Mean |
Max |
| hit |
23.00 |
408.50 |
1691.78 |
129790.00 |
| miss |
16.00 |
2823.50 |
3634.74 |
49457.00 |
| cachable |
|
|
|
|
| uncachable |
|
|
|
|
| fill |
|
|
|
|
| rep |
16.00 |
2029.50 |
2659.42 |
129790.00 |
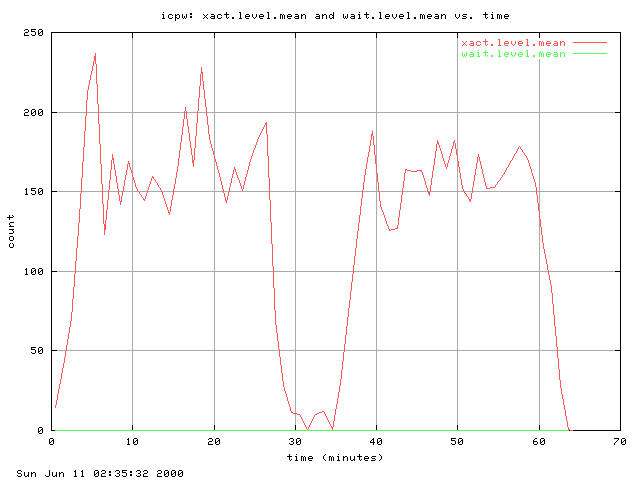
| Wait Queue |
requests |
| Enqueued: | 0.00 |
| Dequeued: | 0.00 |
| Average length: | |
| Stream Rates |
Count
(rep/sec) |
Volume
(MB/sec) |
| hit |
3.84 |
0.47 |
| miss |
3.80 |
0.31 |
| cachable |
6.17 |
0.76 |
| uncachable |
1.47 |
0.02 |
| fill |
2.33 |
0.29 |
| rep |
7.64 |
0.78 |
| Stream Totals |
Count
(rep*106) |
Volume
(GByte) |
| hit |
0.01 |
0.12 |
| miss |
0.01 |
0.08 |
| cachable |
0.01 |
0.19 |
| uncachable |
0.00 |
0.00 |
| fill |
0.00 |
0.07 |
| rep |
0.02 |
0.20 |
| Connection Length |
Min |
Mean |
Max |
| Use (xact/conn) |
1.00 |
1.00 |
1.00 |
| Life time (msec) |
16.00 |
2659.42 |
129790.00 |
| Object Sizes |
Size (KB) |
| Min |
Median |
Mean |
Max |
| hit |
|
|
15.66 |
|
| miss |
|
|
10.55 |
|
| cachable |
|
|
15.83 |
|
| uncachable |
|
|
1.74 |
|
| fill |
|
|
16.10 |
|
| rep |
0.30 |
9.14 |
13.12 |
125.82 |
| Object Class |
Contribution (%) |
| Count |
Volume |
| hit |
50.20 |
59.94 |
| miss |
49.80 |
40.06 |
| cachable |
80.76 |
97.45 |
| uncachable |
19.24 |
2.55 |
| fill |
30.56 |
37.52 |
| rep |
100.00 |
100.00 |
Errors (0.00% of all transactions):
#errno count count% explanation
Potential problems:
- Measured document hit ratio (50.20%) differs
from the offered DHR (55.81%)
by -10.05%.
- Measured byte hit ratio (59.94%) differs
from the offered BHR (66.75%)
by -10.20%.
- ... where A differs from B by X% means X = 100*(A-B)/B.
3. Traces

Generated on Sun Jun 11 02:35:33 2000 by ./make_report icpw